![]()
|
ActiveFLOVE (FLOw Visualization Environment), one of a series of Active'X' visualization systems (among others like ActiveLIC and ActiveIBFV) developed by Zhanping Liu at MSU / HPC / VAIL, is an OpenGL-based explorative flow visualization framework that can be exploited to facilitate the development of specific applications by assembling some of a large number of proprietary high-performance flow visualization components (including geometry-based and texture-based methods) and well-established general-purpose components (such as data processors, color mappers, image readers & writers, image processors, movie makers, to name only a few). These components are in the form of thoroughly-annotated but simply-structured C++ classes such that they can be easily called and updated. ActiveFLOVE originated from the observation that most flow visualization applications share many frequently-used stuffs such as OpenGL rendering context configuration, data processing (for histogram-based range transform, mask or context handling, and data interpolation), (rainbow / colorwheel) color mapping, image input / output (of BMP and EPS files), image processing (cropping / flipping / zooming / mirroring / low-pass filtering / high-pass filtering), matrix / vector computation (for quaternion rotation and vector normalization), and et al. The availability of such components in an easily-reusable self-inclusive (without the need to "#include" any other third-party libraries except for C / C++ standard ones --- otherwise a great deal of time would be wasted to search through complicated class hierarchies for even only a small piece of code and it would be very difficult to make some optimization or customization) form accelerates the development of an application and the implementation of a new idea. Thus ActiveFLOVE provides an efficient platform that enables rapid algorithm prototyping for test and demonstration purposes. One important goal of ActiveFLOVE is to offer an explorative experience from data visualization to the user. In particular, the user is just positioned deep into a data volume or a 3D scene to navigate through the flow, which is able to bring immersive look-and-feel to a WinTel desktop. |
|
ActiveFLOVE
for LIC-based visualization of the layered Northeast Pacific Ocean flow
|
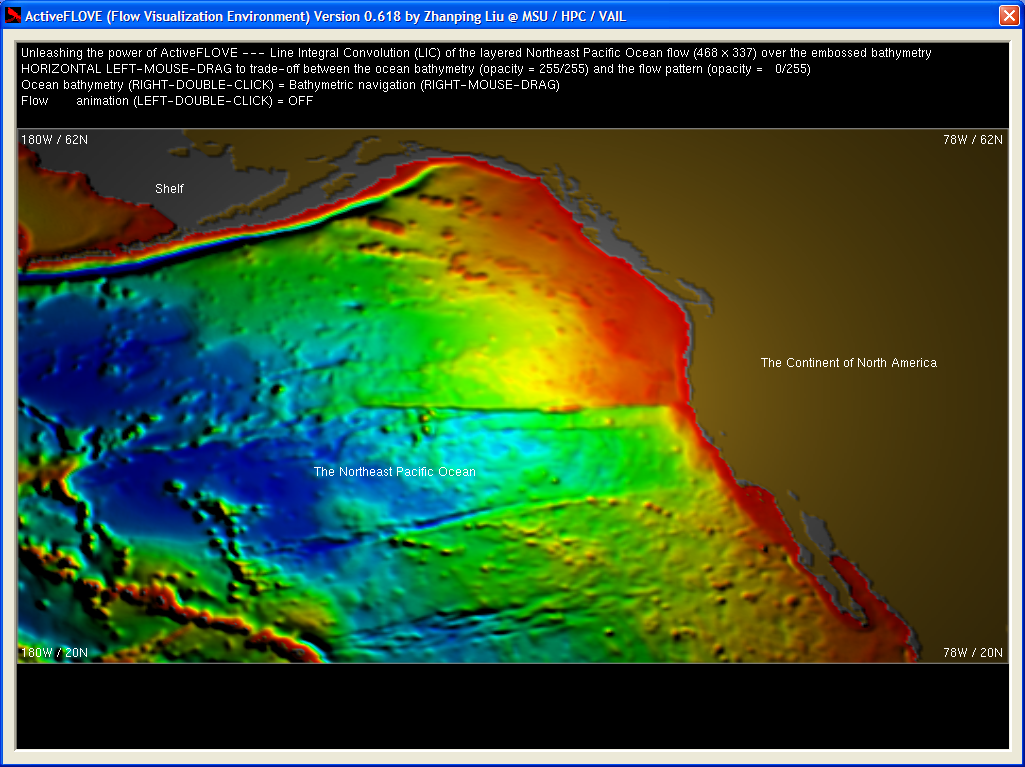
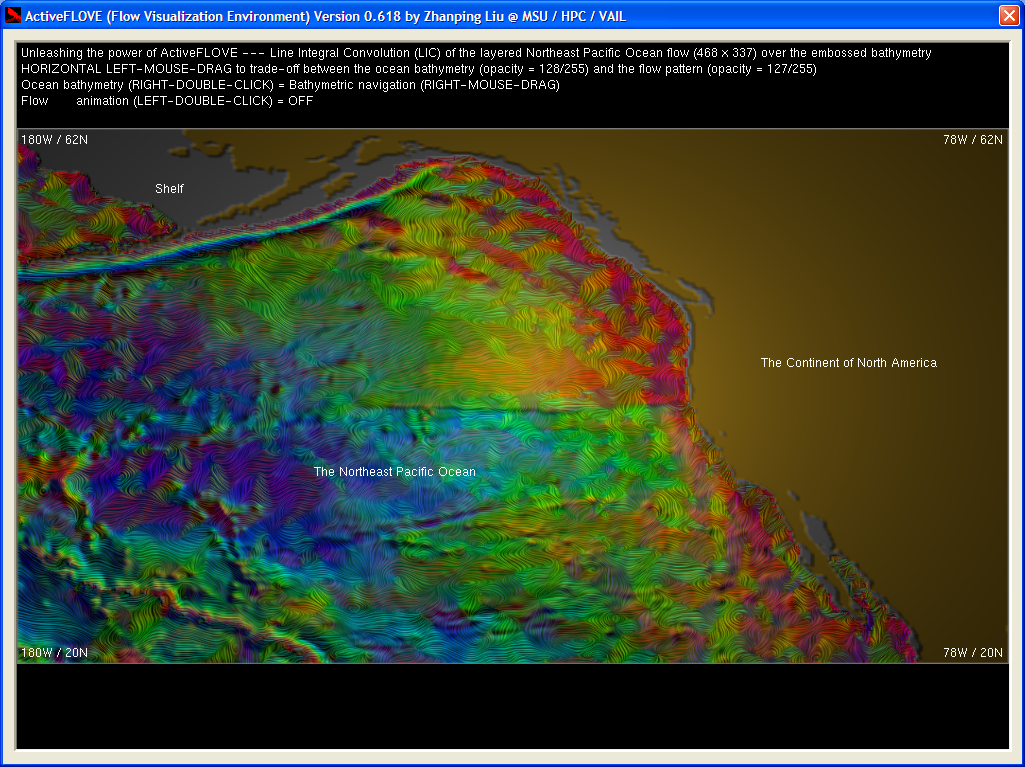
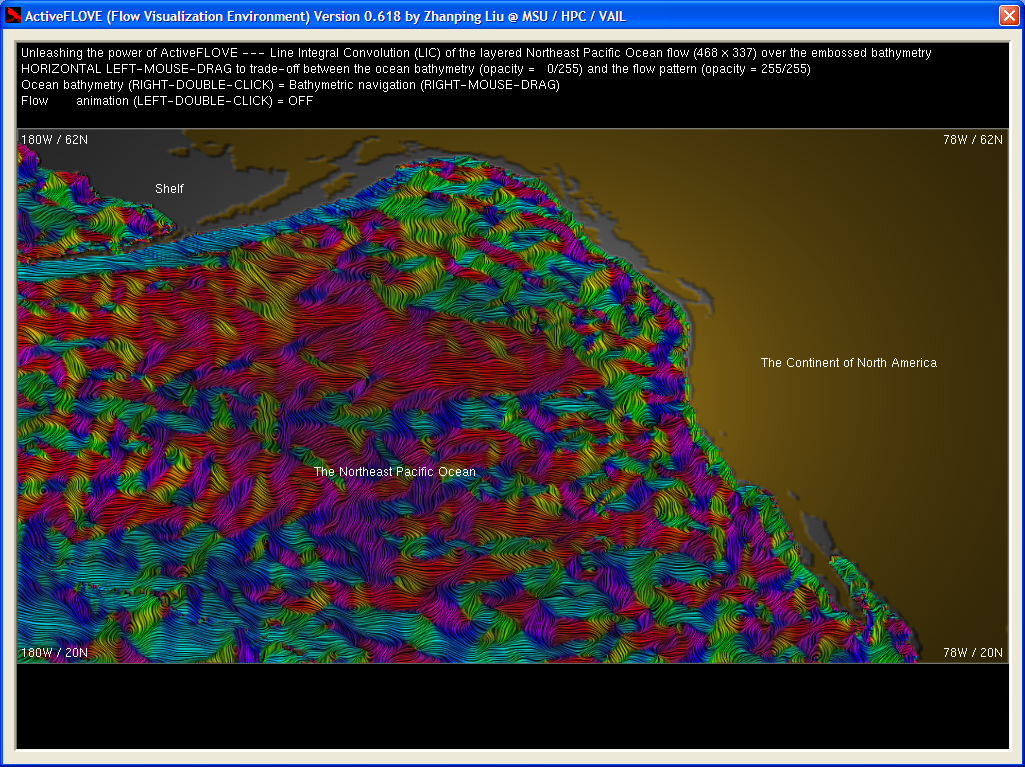
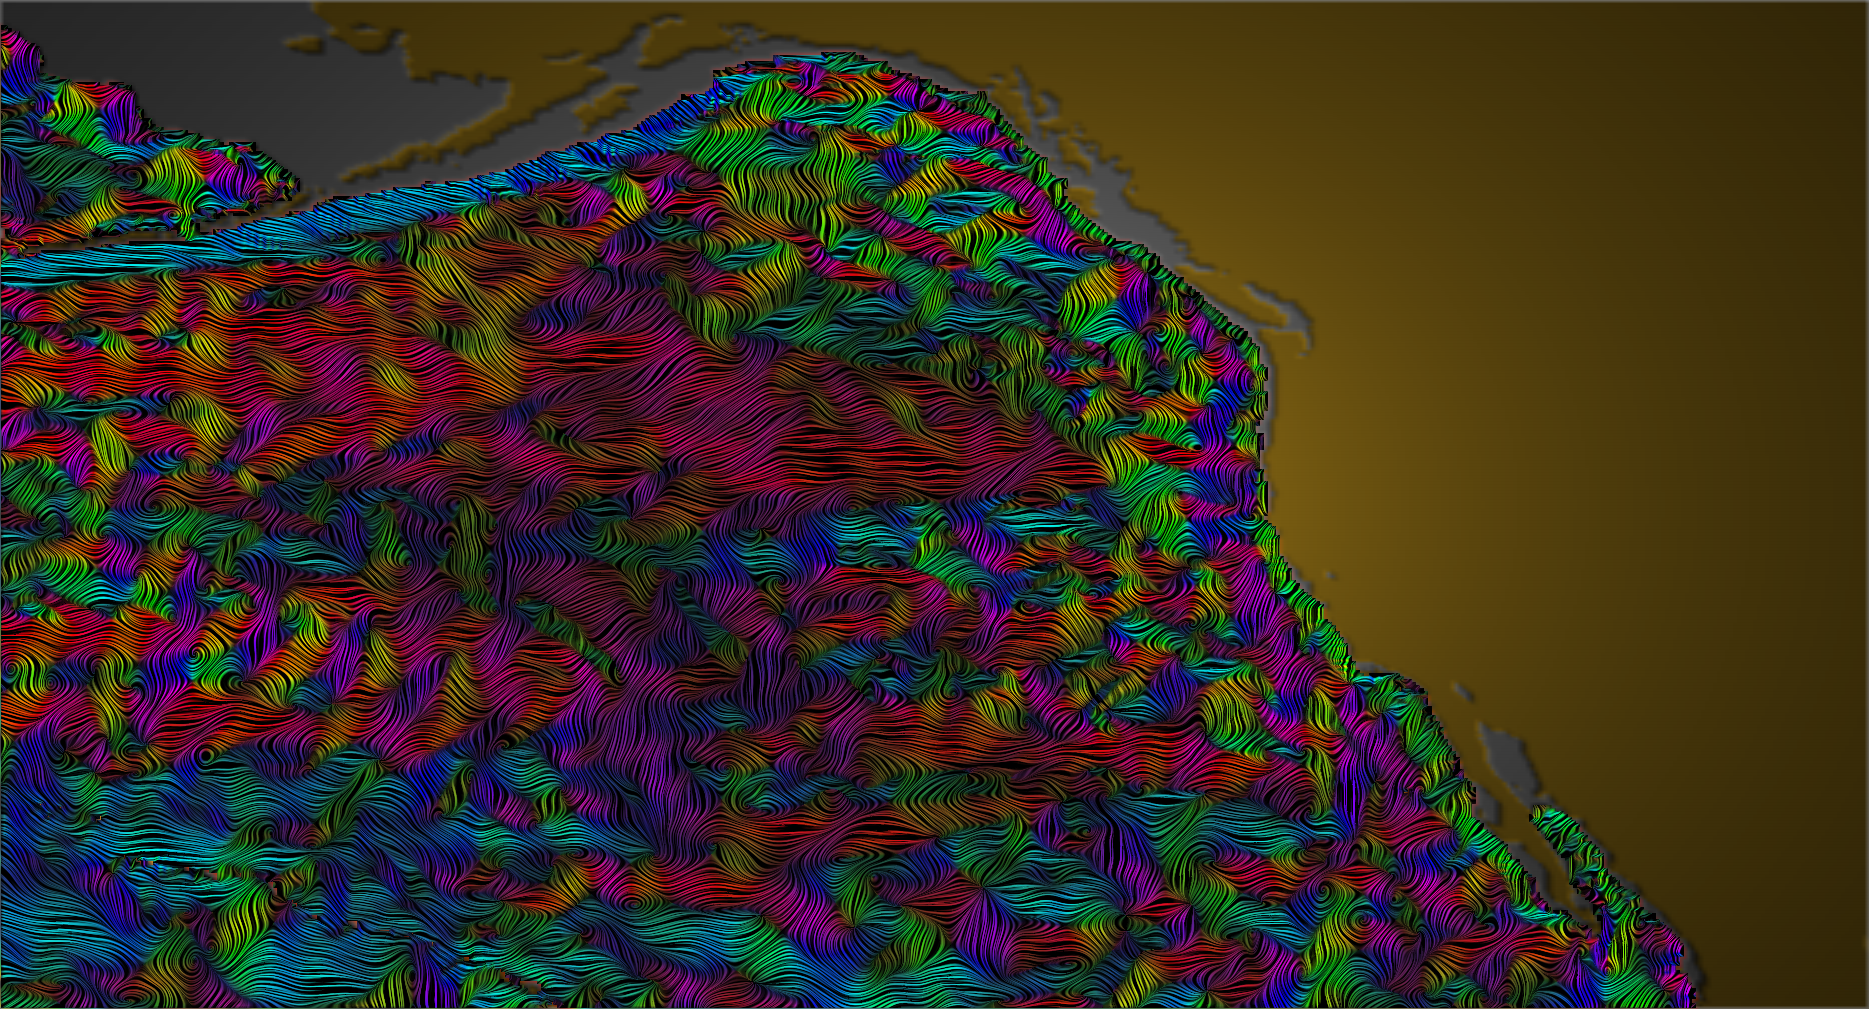
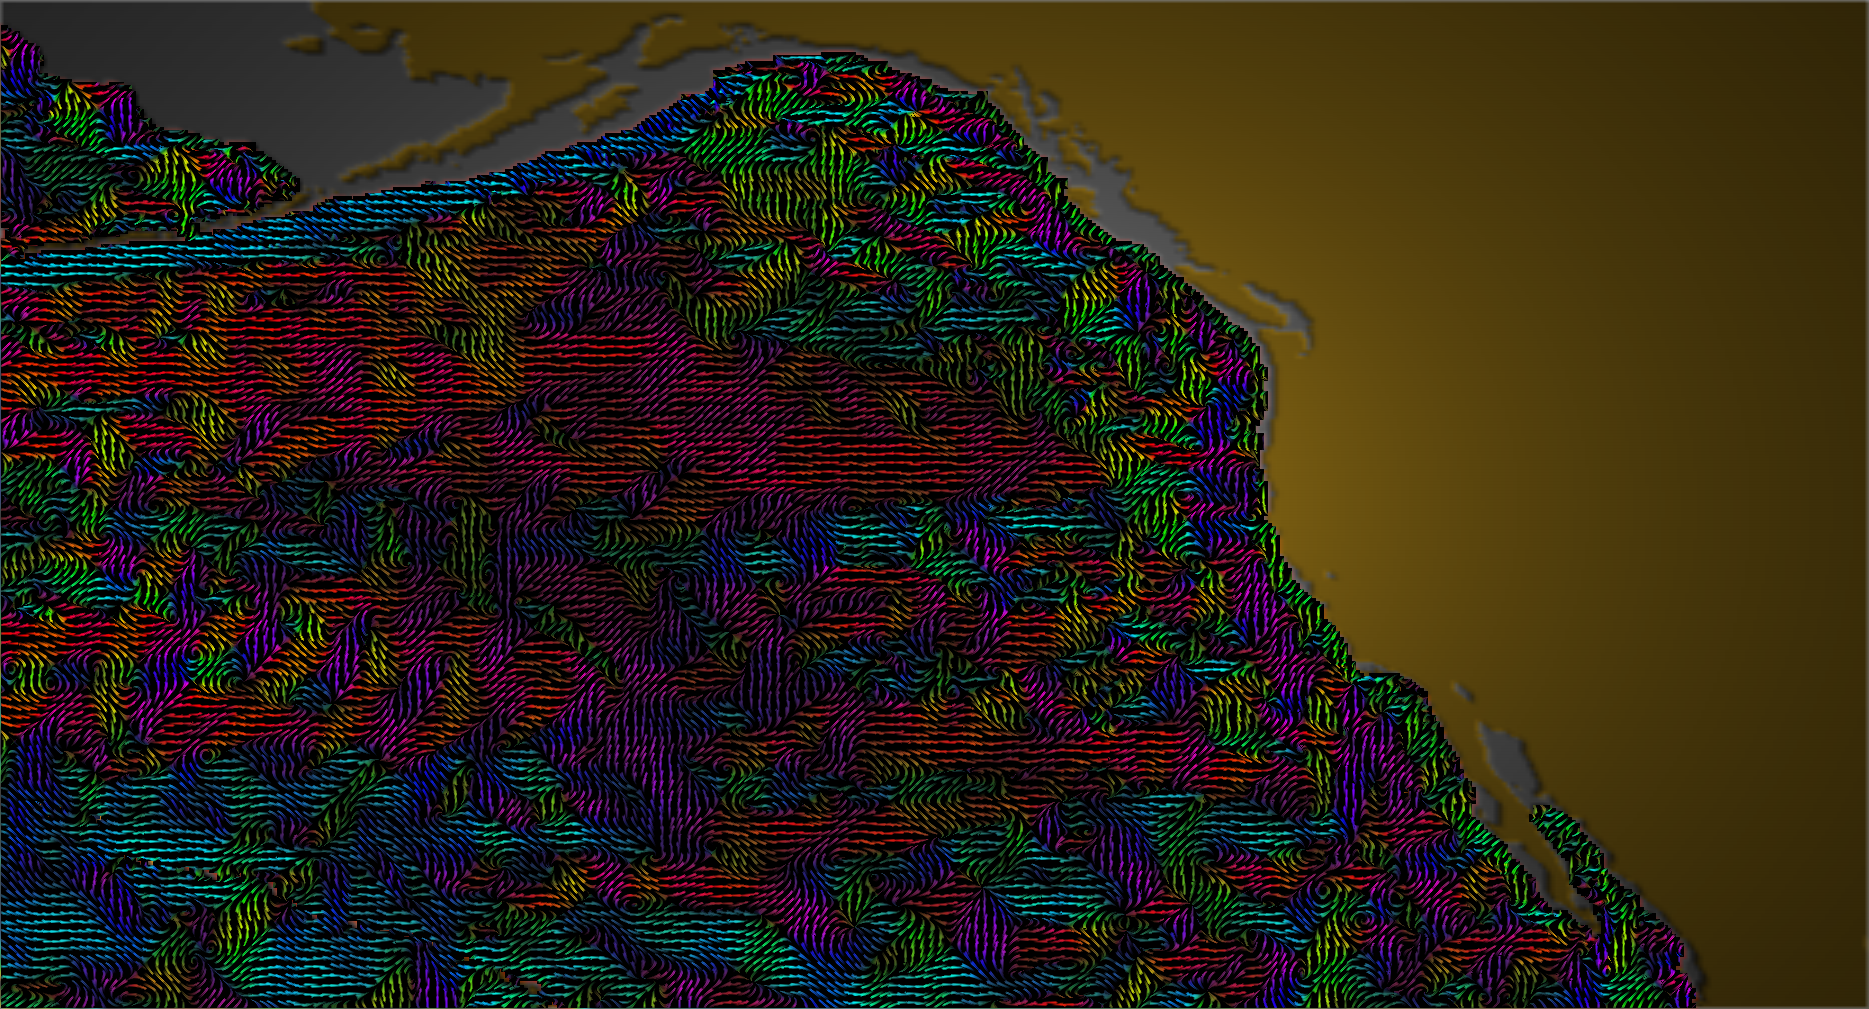
| The following snapshots demonstrate the use of ActiveFLOVE for LIC-based visualization of the layered Northeast Pacific Ocean flow. The underlying ocean bathymetry (depth of the ocean floor) and the continent of North America, both rendered through depth (or height for terrain) embossing, are shown in Figures 1 and 2. Embossing is a pixel-based / image-synthesis technique that can generate a 3D-like appearance (in the form of a curved surface) from an array of depth values (i.e., a 2D depth map) without explicit surface modeling by graphical primitives such as triangles. The basic idea is to reconstruct the surface by applying an illumination model (like the Phong model) to each grid point / pixel, at which the gradient (possibly magnified or minified to alter visual effects) is computed from the original depth values and is used as the normal. Given the viewing direction (perpendicular to the image plane) and typically a point light (and therefore its position --- the altitude over the image plane and the horizontal location --- governs the light direction for each pixel), a gray-scale value can then be easily obtained for each pixel. The gray-scale surface may be further color-coded to convey the depth information in a more intuitive way, e.g., with blue for deepest and red for shallowest. Figures 3 and 4 show the overall visual effects of placing a LIC texture of flow over the ocean bathymetry. Figures 5 shows three high-resolution images (1869 x 1009, 5.5MB) of the flow pattern. |
 |
 |
|
|
Figure 1. The ocean bathymetry
rendered by depth embossing.
|
Figure 2. The ocean bathymetry
exaggerated through gradient magnification.
|
|
 |
 |
|
|
Figure 3. A transparent LIC texture
of flow over the ocean bathymetry.
|
Figure 4.
A fully opaque LIC texture of flow over the ocean bathymetry.
|
 |
 |
 |
|
Figure 5. Three high-resolution
images of the flow pattern (©
Zhanping Liu).
|