![]()
|
INTRODUCTION
|
|
The tremendous advances in genomic expression, molecular design, and protein synthesis demonstrate the significance and prospect of bio-technologies. Molecular biology addresses biomolecular structures, properties, functions, relationships, and mechanisms governing bio-chemical processes. Biomolecular datasets have grown at an exponential rate as increasingly large experiments are performed to gather information using emerging acquisition devices. Without effective data processing and visual analysis methods, biologists can not comprehend large amounts of data, since this would require painstaking cognitive reconstruction. Molecular visualization takes advantage of computer graphics, image processing, virtual reality, and even cognitive psychology to provide biologists with a deep insight into complex structures, fine features, and obscure patterns in large-scale datasets. Data visualization is becoming an indispensable component in modern biological research. Conventional wide-field microscopy employs a condenser lens to uniformly illuminate the wide area of a thick volume of specimen. Out-of-focus light rays emitted from non-focal planes interfere with the focal slice and thus deteriorate the resulting image contrast and resolution, particularly when thick and / or living specimens are used. In general, thin tissue sections and careful manipulations are required to obtain useful data. Confocal microscopy [1] (Fig. 1) addresses this problem by incorporating a specifically designed dichromatic mirror, an objective lens, and a confocal aperture to prevent out-of-focus light rays from reaching the photomultiplier detector. This configuration suppresses out-of-focus blurring and thus generates images with increased resolution and improved contrast from thick or even whole-mount specimens. A slice is acquired by letting the laser beam scan across the specimen. A volume is collected as the focal plane is shifted in the longitudinal direction. A transmitted light image can be captured from an unstained specimen, but a specimen is usually labeled with fluorescent probes to get a multi-channel image. Iso-surface extraction and direct volume rendering (volume rendering) are two classical methods widely used for visualizing volumetric data. Iso-surface techniques such as marching cubes [2], dividing cubes [3], and marching tetrahedrons [4] need to fit intermediate graphical primitives (e.g., triangles) to reconstructed surfaces prior to surface rendering. Volume rendering techniques such as ray casting [5], ray tracing [6], splatting [7], shear-warp [8], and hardware-based texture mapping [9] eliminate the construction of geometric representations, but instead operate directly on voxels by using a light absorption-transmission model and a transfer function to assign colors and opacities to voxels that are then composited along view directions. As evidenced by numerous publications [3], [5], [9], iso-surface and volume rendering are well established in visualizing medical data (e.g., CT, MRI). However, there have been only a few reports on visualization of confocal microscopic biomolecular data [10], [11], [12], [13]. The problems that this kind of data brings to volume visualization are drawing more and more attention. |
 |
|
Figure 1: Confocal Microscopy.
|
|
CHALLENGES
|
|
The widespread adoption of confocal microscopy in molecular biology is attributed to out-of-focus light elimination, increased resolution, improved contrast, multi-channel imaging of co-localized objects, and non-invasive "optical sectioning" of thick specimens. However, there are still a variety of factors in combination with inherent optical characteristics, which may affect image quality and numerical accuracy during data acquisition. Furthermore, intangible amorphous micro-structures and lack of a priori knowledge make it a daunting task to visualize confocal microscopic biomolecular data. First, low signal-to-noise ratio and low image contrast require effective data processing and image enhancement techniques to treat both slices and the volume to retain small structures and restore fuzzy features. Second, the longitudinal resolution is at least 3 ~ 4 times lower than the lateral resolution and therefore the volume is smeared in the longitudinal direction. Interpolation may introduce artifacts if the raw data is simply re-sampled to generate regular voxels. Third, large-scale datasets require efficient algorithms to achieve interactive visualization for trial-and-error exploration that is usually needed for an unfamiliar dataset. The size of a three-channel volume data with a resolution of 512 × 512 × 64 is 48MB and it is even much larger when time-varying scenarios are considered. Given the current computing capability and commodity graphics cards, it is still difficult to visualize a large dataset in real time using computationally intensive visualization methods like volume rendering. Medical datasets tend to contain shape-invariant organs, smooth and well-defined boundaries, and only a few continuous objects that may be easily segmented. However, biomolecular datasets usually have amorphous structures, ragged contours, porous surfaces, and numerous disconnected small objects. These properties make it extremely difficult to extract and track features in time-varying datasets. Compared to medical datasets for which a considerable amount of a priori knowledge is available to validate visualization results and quickly tune parameters to find features of interest, biomolecular datasets with amorphous structures often leave the user uncertain about visualization results. It is also difficult to distinguish artifacts introduced in acquisition or visualization from real structures. Finally, a confocal microscopic dataset is longitudinally thin (e.g., 512 × 512 × 15), which affects perception of depth. Due to the aforementioned problems, visualization techniques well suited for medical data may not produce satisfactory results when used for confocal microscopic data. Novel methods need to be developed to address these challenges. |
|
RELATED
WORK
|
|
Visualization of confocal microscopic biomolecular data has been applied to study intra-cellular / extra-cellular structures, cellular processes of protein transport, neuromorphology, and time-varying structures of polymerized actin [14]. Janacek and Kubinova [15] employed Iris eXplorer to extract, display, and measure iso-surfaces from tobacco cell chain and capillary bed in terminal vilus of human placenta. Kraemer [16] developed Topologizer using VTK and Perl to visualize neuropils olfactory glomeruli in a beetle brain. Object-based segmentation and measured-concentration based segmentation were proposed to study dynamic topological properties that an object retains under deformation. Other packages such as OpenDX, MicroVoxel, and VoxelView were also used for image segmentation and registration, geometry reconstruction, and measurement of surface areas and enclosed volumes. Kaufman et al. [10] discussed some key issues for visualizing confocal microscopic data and proposed solutions for surface discrimination and shading. They developed BioCube, a visualization environment for volumetric exploration of actin cytoskeleton structures. Brady et al. [11] developed a CAVE-based system called Crumbs for immersive data visualization, identification and tracking of fibrous Drosophila embryos, and segmentation of intricate cartilage in a horse fetlock. Monks et al. [12] applied iso-surface, volume rendering, and virtual reality techniques to provide an enhanced visual understanding of communications between cells of an immune system by displaying co-locality of 3D proteins capable of interacting with one another. Fang et al. [17] integrated a shear-warp algorithm based on 2D texture mapping, an adjustable transfer function design based on image processing, and a boundary detection method in IVIE system for interactive volume visualization of noisy confocal microscopic data. Confocal microscopic data is still subject to noise and artifacts and even susceptible to longitudinal smearing, which complicates image segmentation and feature extraction. Razdan et al. [18] adopted some methods to remove noise, suppress artifacts, and enhance edges in the pre-processing stage to improve image quality. TINVIZ was developed to visualize multi-channel data using ray casting and a voxel-level merging approach. Kyan et al. [13] employed local energy as an image statistics for surface detection, and Kohoonen self-organizing feature map, which is an image segmentation method based on neural networks, for effective feature extraction from translucent chromosomes. Mullick et al. [19] presented a fast algorithm driven by physically defined parameters to show internal structures without using a traditional segmentation process which might cause artifacts. Maddah et al. [20] proposed an automatic 3D center-line extraction algorithm based on distance transform and path planning to extract elongated vessels from branching structures of rat brains. Connected thin center-lines can be accurately and rapidly generated without user interaction or a priori knowledge of the object shape. Visualization of time-varying confocal microscopic data helps interpret complex bio-chemical processes. De Leeuw et al. [21] used iso-surface, volume rendering, and animation techniques to show the functioning of living cells. They then developed an interactive visualization and feature tracking system to investigate the movement of chromatin during de-condensation. Features are defined as points in a multi-dimensional attribute space while the distance between two points is taken as a metric to evaluate the feature correspondence [22]. Recently they adopted landmark-based and voxel-based methods in retaining only internal cell movement while removing acquisition-induced external motion from time-dependent chromatin datasets [23]. |
|
CASE
STUDY
|
|
|
| MOTIVATION |
|
We are working on visualization of biomolecular structures from large-scale confocal microscopic data to help biologists
One goal is to develop a CAVE-based visualization system to facilitate the discovery of similarities and discrepancies between structures, to help solve connectivity and docking problems (proteins, enzymes, drugs), and to allow interactive manipulation of the structures to study properties to predict the behavior of new molecules and specifically-designed RNA in an immersive environment. Amira [24] is a modular, object-oriented geometry reconstruction, data visualization, and pattern analysis package supporting Tool Command Language (TCL) and component (data objects and computational / rendering modules) networks. It offers a shortcut to the cutting edge of biomolecular visualization so that research efforts can be directly focused on algorithm design and problem solving. Amira allows us to add in custom modules such as data readers, data writers, data processing and visualization routines, and scene rendering programs based on Open Inventor to enhance the already powerful visualization capability. AmiraVR, an important extension of Amira for virtual reality applications, enables us to quickly develop an immersive biomolecular data visualization system based on a four-wall CAVE. Biologists at the University of Southern Mississippi, our collaborators, acquired a multi-channel volume dataset (dimensions: 512 x 512 x 15; rectilinear voxel size: 0.0557892um x 0.0557892um x 0.3642286um) using confocal microscopy from a budding yeast saccharomyces cerevisiae containing two transcriptional activators: protein GCR1 and protein GCR2. GCR1 was labeled with transgenetic Cyan Fluorescent Protein (CFP) and excited by a 458nm laser to generate channel #1 while GCR2 was labeled with transgenetic Yellow Fluorescent Protein (YFP) and excited by a 514nm laser to generate channel #3. Channel #2 was captured by using Differential Interference Contrast (DIC) as a transmitted light image with enhanced contrast. The biologists attempted to gain a better understanding of the interaction between proteins GCR1 and GCR2 through interactive data visualization than mental reconstruction. |
| PRE-PROCESSING |
|
Confocal microscopy introduces so-called z-drop artifacts during volume data acquisition due to light absorption by slices. As a result, the average intensity in lower slices tends to be decreased. To correct the intensity attenuation, we adjusted the average intensity in each slice by multiplying by an exponential function j = a x EXP[ -b x (N - 1 - n) / (N - 1) ]where a and b are user-defined parameters tunable based on the number of slices N, and n is the slice index ranging from 0, the highest slice, to (N - 1), the lowest slice. We chose a = 1.05 and b = 0.15 to correct the aforementioned data. The raw volume data was first quickly displayed using a projection view, which shows three orthogonal slice images generated by projecting the maximum (or average) values through the volume in the x, y, and z directions, respectively, and color-mapping the resulting values, i.e., by axis-aligned Maximum Intensity Projection (MIP). The Region of Interest (ROI) was then easily located based on the sketch patterns to visually prune blank surrounding regions in the data pre-processing stage, which reduced the computational workload for an increased rendering speed. |
| HYBRID RENDERING |
| To provide strong spatial-correlation cuing, the cropped volume data was visualized in four separate views with the same viewing settings, three of which allow the biologists to investigate individual channels while the fourth provides a combined view. In this way, the biologists easily noticed the interaction between GCR1 (color-mapped to green) and GCR2 (color-mapped to yellow) that are surrounded by channel 2 (color-mapped to red). Fig. 2 and Fig. 3 show four images generated using iso-surface extraction and volume rendering, respectively. Iso-surface extraction is good at representing region boundaries using crisp surfaces while volume rendering is well suited for displaying dense volumes using visually pleasing translucent clouds. We thus incorporated these two techniques to obtain hybrid rendering to display clear-cut protein boundaries and amorphous interior materials in the same view volume. Our observation is that hybrid rendering can effectively highlight certain parts as the focus while retaining other parts as the context, which helped the biologists gain a clear view and intuitive comprehension of the spatial relationship between different objects. Fig. 4 shows four images with the channels highlighted in different combinations. |
 |
 |
 |
|
|
|
| PROTEIN INTERACTION |
| Besides the protein interaction, the biologists were very interested in the overlap of the proteins, i.e., how much and where the two proteins interact with each other. A straightforward way to determine this is to extract a channel of correlation where channel #1 and channel #3 co-locate. We implemented this by embedding a data processing module in Amira. Some fields are provided for the user to tune parameters. The range fields not only allow the user to focus on data bands of interest and also serve as thresholds to suppress noise. The overlap can be synthesized using addition, multiplication, or more sophisticated interpolation schemes for highlighting to some extent one of the components. As the scene is rotated, translated, and zoomed in / out, the channels can be volume rendered at interactive frame rates on an SGI Onyx 2 InfiniteReality 4 thanks to hardware-based 3D texture mapping. Fig. 5 shows the channels volume rendered with the overlap (color-mapped to blue) extracted. Fig. 6 shows the extracted overlap in hybrid rendered views. From these images, the biologists could see where the two proteins do and do not interact. The biologists also learned that the interaction is scattered within some regions, but does not occupy a continuum. This helped the biologists obtain further information about how the interaction spreads. Fig. 7 shows the Amira component network used to achieve the visualization by calling the embedded C ++ module. |
 |
 |
 |
|
|
|
| INTENSITY OF INTERACTION |
|
The scattered protein interaction
gave rise to another question of significance to the biologists' study,
i.e., how intensity of interaction is distributed in proteins. Hot spots
(i.e., regions with highest intensities) may provide both important guidance
for investigating local biological properties and informed steering for
follow-up multi-channel data acquisition. A trivial approach is to compute
for each interaction voxel the number of interaction voxels that are enclosed
within a fixed-size sub-volume centered at the voxel. However, it falls
short of accuracy in evaluating intensity of interaction in detail since
two such sub-volumes with the same number of interaction voxels may have
largely varying densities relative to the sub-volume centers. To address
this problem, we adopted a better solution, i.e., 7 x 7 x 7 three-dimensional
Gaussian convolution, to represent local intensity of interaction. We
implemented this using a C ++ module, which was embedded in the aforementioned
Amira component network to generate another channel. The intensity values
were normalized and scaled to the range of 0~255 for qualitative visualization.
Volume rendering other than iso-surface is the obvious technique of choice
to delineate relative intensities of scattered protein interaction through
a translucent cloud. Fig. 8 shows two volume
rendered images of the intensity of the interaction between GCR1 and GCR2.
Voxels are color-mapped based on the intensity with blue being lowest
and red highest. Higher opacities are assigned to voxels with higher intensity
values, and vice versa, which allows the user to easily locate hot spots
by modulating voxel opacities with an adjustable overall opacity. The
left image generated with a higher overall opacity (0.85) shows some hot
spots discernible through translucent interleaved lower-intensity regions,
part of which are removed by using a lower overall opacity (0.45) in the
right image to reveal interior hot spots.
|
| CAVE-BASED EXPLORATION |
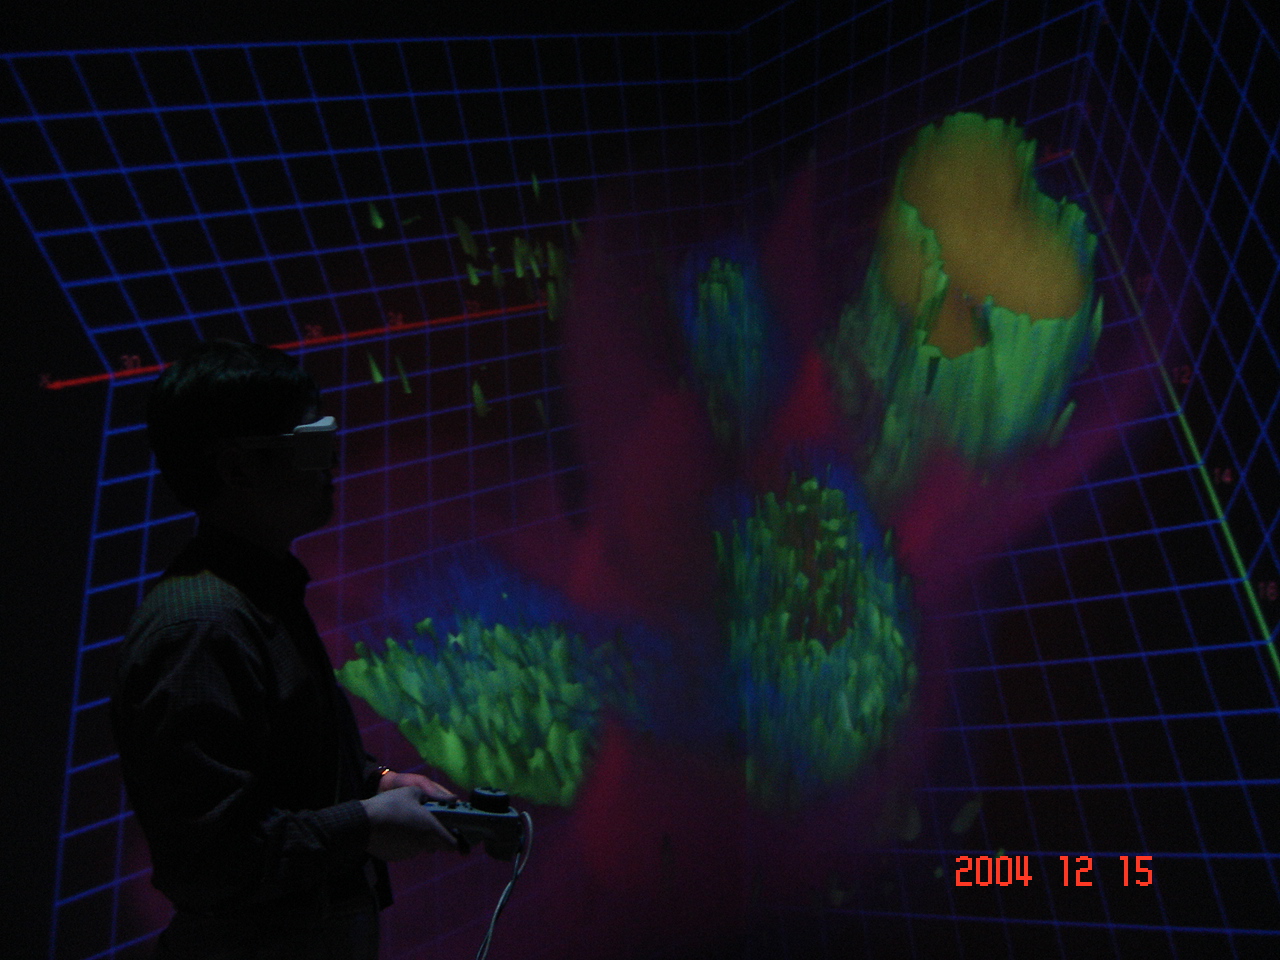
| Along with the rapid developments in high-performance computing, large-scale memory capacity, high-speed graphics cards, and high-resolution displays come the breakthroughs in human computer interface. Compared to traditional 2D desktop displays, virtual environments provide more interactive and immersive modalities to enhance human perception of 3D scenes. Cave Automatic Virtual Environment (CAVE) is a four-wall, room-sized, multi-person, high-resolution, three-dimensional audio-video theater for perceptually more intuitive visualization and interactive exploration of scientific data. AmiraVR, an extension of Amira for immersive visualization, supports multi-threaded rendering on multi-pipe machines, Head Mounted Devices (HMDs), wands, active and passive stereo modes, and soft edge blending. Some APIs are provided to add custom display modules to meet specific interaction needs. We leveraged AmiraVR and CAVE in the case study to provide the user with an immersive look and feel of the micro-structures to investigate the interaction mechanism in more detail as the user navigates through the proteins. Fig. 9 shows a snapshot of CAVE-based visualization of the above multi-channel data. |
 |
 |
|
|
|
CONCLUSIONS
AND FUTURE WORK
|
|
Visualization of confocal microscopic biomolecular data is a challenging research topic due to low signal-to-noise ratio, low image contrast, longitudinal smearing, large data size, amorphous structures, ragged contours, porous surfaces, numerous disconnected small objects, and in particular lack of a priori knowledge about intractable, possibly time-varying micro-structures. Effective visualization techniques need to be developed to address confocal microscopic biomolecular data. The data pre-processing techniques and the correlation-based channel extraction method introduced in this paper are very effective in artifacts suppression, noise removal, and ROI location. Some techniques such as the statistics-based evaluation of intensity of protein interaction, though simple, are very appropriate to meet specific visualization needs of the user. Hybrid rendering is a powerful visualization approach, which draws on the advantages of both isosurface extraction and volume rendering to provide various aspects of insights into the volume data in the same view. Immersive visualization based on CAVE even provides more intuitive perception of the data. Future work goes in many directions including image de-convolution, image segmentation and registration, effective transfer function design for volume rendering, and feature extraction and tracking in time-varying data. |
|
REFERENCES
|
| [ 1] Stephen W. Paddock, Thomas J. Fellers, and Michael W. Davidson, "Introduction to Confocal Microscopy --- Basic Concepts," http://www.microscopyu.com/articles/confocal/confocalintrobasics.html. |
| [ 2] William E. Lorensen and Harvey E. Cline, "Marching Cubes: A High Resolution 3D Surface Construction Algorithm," Computer Graphics, Vol. 21, No. 4, pp. 163-169, 1987. |
| [ 3] H. E. Cline, W. E. Lorensen, S. Ludke, C. R. Crawford, and B. C. Teeter, "Two Algorithms for the Three-Dimensional Construction of Tomograms," Medical Physics, Vol. 15, Vol. 3, pp. 320-327, 1988. |
| [ 4] Andre Guezier and Robert Hummel, "Exploiting Triangulated Surface Extraction Using Tetrahedral Decomposition," IEEE Transactions on Visualization and Computer Graphics, Vol. 1, No. 4, pp. 328-342, 1995. |
| [ 5] Marc Levoy, "Display of Surfaces from Volume Data," IEEE Computer Graphics and Applications, Vol. 8, No. 5, pp. 29-37, 1988. |
| [ 6] Roni Yagel, Daniel Cohen, and Arie Kaufman, "Discrete Ray Tracing," IEEE Computer Graphics and Applications, Vol. 12, No. 5, pp. 19-28, 1992. |
| [ 7] Lee Westover, "Footprint Evaluation for Volume Rendering," Computer Graphics, Vol. 24, No. 4, pp. 367-376, 1990. |
| [ 8] Philippe Lacroute and Marc Levoy, "Fast Volume Rendering Using a Shear-Warp Factorization of the Viewing Transformation," Proceedings of ACM SIGGRAPH 94, Orlando, Florida, July 24-29, pp. 451-458, 1994. |
| [ 9] Brian Cabral, Nancy Cam, and Jim Foran, "Accelerated Volume Rendering and Tomographic Reconstruction Using Texture Mapping Hardware," Proceedings of IEEE Symposium on Volume Visualization 94, Tysons Corner, Virginia, Oct. 17-18, pp. 91-98, 1994. |
| [10] Arie Kaufman, Roni Yagel, R. Bakalash, and I. Spector, "Volume Visualization in Cell Biology," Proceedings of IEEE Visualization 90, San Francisco, California, Oct. 23-26, pp. 160-167, 1990. |
| [11] Rachael Brady, John Pixton, George Baxter, Patrick Moran, Clinton S. Potter, Bridget Carragher, and Andrew Belmont, "Crumbs: A Virtual Environment Tracking Tool for Biological Imaging," Proceedings of IEEE Visualization 95, Atlanta, Georgia, Oct. 29-Nov. 3, pp. 18-25, 1995. |
| [12] Colin R. F. Monks, Patricia J. Crossno, George Davidson, Constantine Pavlakos, Abraham Kupfer, Claudio Silva, and Brian Wylie, "Three Dimensional Visualization of Proteins in Cellular Interactions," Proceedings of IEEE Visualization 96, San Francisco, California, Oct. 27-Nov. 1, pp. 363-366, 1996. |
| [13] Matthew J. Kyan, Ling Guan, Matthew R. Arnison, and Carol J. Cogswell, "Feature Extraction of Chromosomes from 3D Confocal Microscope Images," IEEE Transactions on BioMedical Engineering, Vol. 48, No. 11, pp. 1306-1318, 2001. |
| [14] Georgios Sakas, Michael G. Vicker, and Peter J. Plath, "Case Study: Visualization of Laser Confocal Microscopy Datasets," Proceedings of IEEE Visualization 96, San Francisco, California, Oct. 27-Nov. 1, pp. 375-379, 1996. |
| [15] Jiri Janacek and Lucie Kubinova, "3D Reconstruction of Surfaces Captured by Confocal Microscopy," Acta Stereologica, Vol. 17, No. 2, pp. 259-264, 1998. |
| [16] Alexander Kraemer, "Topologizer for Analysis and Visualization of Microscopic Slide Stack by VTK," Proceedings of Visualization Development Environments 00, Princeton, New Jersey, 2000, http://busselab.uni-kiel.de/Site1/downloads/selectedpublication/P02kraemerVDE2k.pdf. |
| [17] ShiaoFen Fang, Yi Dai, Frederick Myers, and Mihran Tuceryan, "Three-Dimensional Microscopy Data Exploration by Interactive Volume Visualization," Journal of Scanning Microscopies, Vol. 22, No. 4, pp. 218-226, 2000. |
| [18] Anshuman Razdan, Kamal Patel, Gerald E. Farin, and David G. Capco, "Volume Visualization of Multicolor Laser Confocal Microscope Data," Computers and Graphics, Vol. 25, No. 3, pp. 371-382, 2001. |
| [19] Rakesh Mullick, R. Nick Bryan, and John Butman, "Confocal Volume Rendering: Fast Segmentation-Free Visualization of Internal Structures," Proceedings of SPIE Medical Imaging 2000 --- Image Display and Visualization, SPIE Vol. 3976, San Diego, California, Feb. 12-17, pp. 70-76, 2000. |
| [20] Mahnaz Maddah, Ali Afzali Kusha, and Hamid Soltanian Zadeh, "Fast Center-Line Extraction for Quantification of Vessels in Confocal Microscopy Images," Proceedings of IEEE Symposium on Medical Imaging, Washington DC, July 7-10, pp. 461-464, 2002. |